How to Read Crypto Market Charts and Indicators
Crypto Market Charts and Indicators
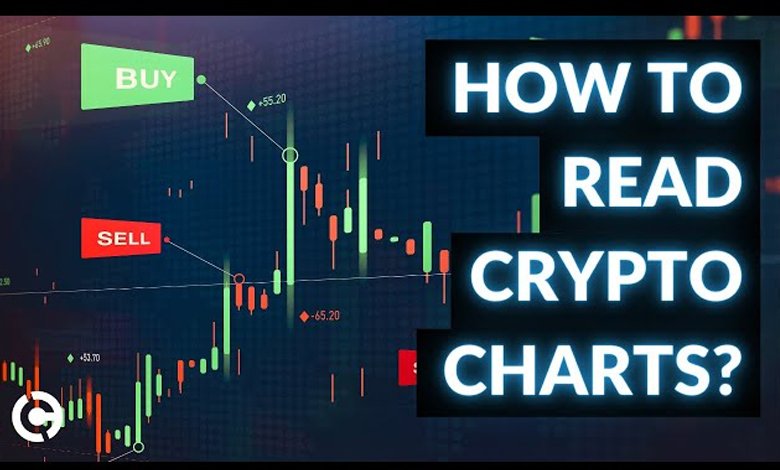
📈 How to Read Crypto Market Charts and Indicators (Beginner’s 2025 Guide)
The world of cryptocurrency trading can feel complex at first — with candles, lines, and countless technical indicators flashing across your screen.
But once you understand the basics of crypto charts and indicators, you’ll see that they’re powerful tools to help you make smarter trading decisions.
In this beginner’s guide, we’ll break down how to read crypto charts, understand market trends, and use indicators — step by step.
⚠️ Disclaimer: This article is for educational purposes only and not financial advice. Always do your own research (DYOR) before investing or trading crypto.
🧭 1. Understanding the Basics of Crypto Charts
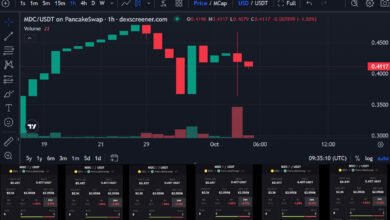
When you open a crypto trading app or platform like Binance, Coin DCX, or WazirX, you’ll usually see a chart that shows the price movement of a coin over time.
The two most common chart types are:
-
Line Chart: Simple and easy — shows how the price has moved over time using a continuous line.
-
Candlestick Chart: The most popular among traders. Each “candle” represents price movement in a specific time period (like 1 minute, 1 hour, or 1 day).
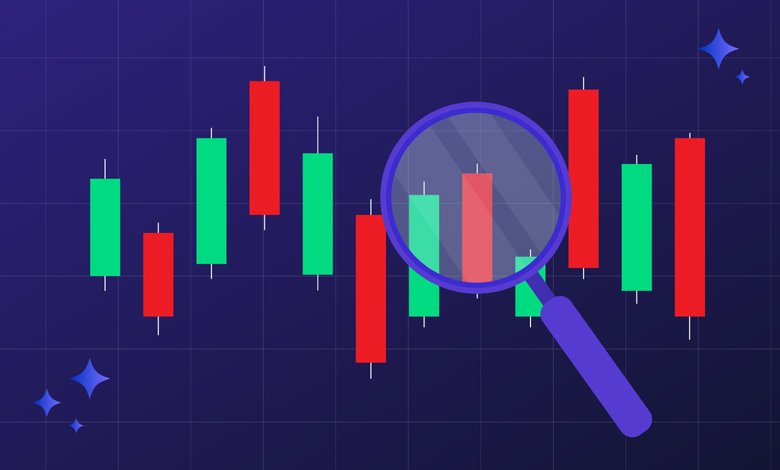
🕯️ 2. How to Read a Candlestick Chart
A candlestick has four key parts:
| Part | Meaning |
|---|---|
| 🟩 Open | The price at which the candle started for that time frame |
| 🟥 Close | The price at which the candle ended |
| 🔼 High | The highest price reached |
| 🔽 Low | The lowest price reached |
Color Coding:
-
Green Candle: Price increased during that time.
-
Red Candle: Price decreased during that time.
Each candle tells a story — for example:
-
A long green candle = strong buying pressure.
-
A long red candle = strong selling pressure.
-
Small candle with long wicks = indecision or volatility.

📊 3. Time Frames Matter
Charts can show different time frames — from 1 minute to 1 month.
-
Short-term traders (scalpers) use 1-minute to 15-minute charts.
-
Swing traders prefer 4-hour or daily charts.
-
Long-term investors use weekly or monthly charts to identify major trends.
👉 Pro Tip: Always look at multiple time frames before making a decision. A coin that looks bullish on the 15-minute chart might be bearish on the daily one.
🧠 4. Key Crypto Indicators Every Beginner Should Know
Technical indicators help traders analyze patterns and predict possible future movements. Let’s explore the most useful ones 👇
🪙 a. Moving Averages (MA & EMA)
Purpose: To identify trend direction and potential reversals.
-
Simple Moving Average (SMA): Average closing price over a set number of days.
-
Exponential Moving Average (EMA): Similar but gives more weight to recent prices.
Example:
If the 50-day EMA crosses above the 200-day EMA, it’s called a Golden Cross (bullish signal).
If it crosses below, it’s a Death Cross (bearish signal).
📉 b. Relative Strength Index (RSI)
Purpose: Measures momentum — whether a coin is overbought or oversold.
-
RSI scale: 0 to 100
-
Above 70 → Overbought (price might drop soon)
-
Below 30 → Oversold (price might rise soon)
Pro Tip: Use RSI with other indicators for confirmation — don’t rely on it alone.
📈 c. MACD (Moving Average Convergence Divergence)
Purpose: Tracks momentum and trend changes.
-
MACD Line and Signal Line crossovers show buy/sell signals.
-
When MACD crosses above Signal → bullish.
-
When it crosses below → bearish.
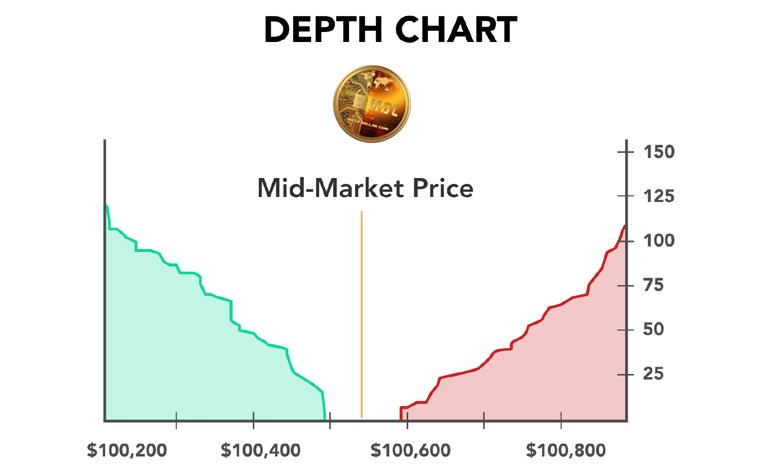
📊 d. Volume Indicator
Purpose: Measures how much of a coin is being traded.
High volume = strong conviction behind a move.
Low volume = weak or uncertain move.
Example:
If price increases on high volume, it’s a strong bullish sign.
If price increases on low volume, it might be a false breakout.
💹 e. Bollinger Bands
Purpose: Measures volatility and potential breakout zones.
It consists of:
-
Middle Line: Moving average
-
Upper and Lower Bands: Represent volatility levels
When price moves close to the upper band, the coin may be overbought.
When it touches the lower band, it may be oversold.
🧩 5. Combining Indicators for Better Decisions
No single indicator gives 100% accurate results.
Smart traders combine 2–3 indicators for confirmation.
⚖️ 6. Common Mistakes Beginners Should Avoid
-
❌ Overusing too many indicators — it leads to confusion.
-
❌ Ignoring fundamentals — news and market sentiment matter.
-
❌ Trading with emotions — fear and greed destroy strategy.
-
❌ Not setting stop-loss orders — always protect your capital.