How to Read Charts and Data on Coin Market Cap Like a Pro
Read Charts and Data on Coin Market Cap

How to Read Charts and Data on Coin Market Cap Like a Pro
Whether you’re new to crypto investing or an experienced trader, understanding the data on Coin Market Cap (CMC) is essential for making smart decisions. Coin Market Cap is more than just a price-tracking website — it’s a powerful analysis tool that can reveal hidden trends, investor sentiment, and market strength.
Let’s break down how you can read and interpret Coin Market Cap charts and data like a pro.

1. Start with the Basics: Price, Market Cap & Volume
When you open any coin page on Coin Market Cap, you’ll first see three key numbers:
🪙 Price
This shows the current trading value of a coin across all major exchanges.
-
Watch for the 24-hour change (%) — it tells you short-term momentum.
-
Use the 7-day or 30-day view to gauge mid-term trends.
💰 Market Capitalization
Formula:
👉 Market Cap = Price × Circulating Supply
A higher market cap usually means the coin is more stable but less volatile — ideal for long-term holding.
Smaller caps often bring higher risk but higher potential reward.
🔄 Trading Volume (24h)
Volume shows how much of a coin has been traded in the last 24 hours.
-
High volume = strong investor interest and liquidity.
-
Low volume = weak demand or potential price manipulation.
2. Understanding Circulating, Total, and Max Supply
Supply directly affects a coin’s price potential.
| Term | Meaning | Why It Matters |
|---|---|---|
| Circulating Supply | Coins currently in public hands | Used to calculate market cap |
| Total Supply | All coins that exist (including locked/staked) | Helps you assess inflation risk |
| Max Supply | The total coins that will ever exist | Fixed supply (like Bitcoin’s 21M) can create scarcity |
Pro Tip:
Coins with a limited max supply (like Bitcoin) often attract long-term investors, while those with unlimited supply require constant demand to maintain value.
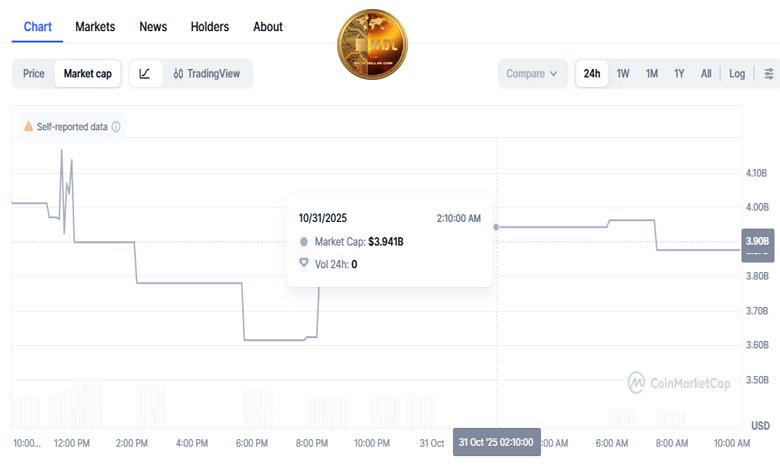
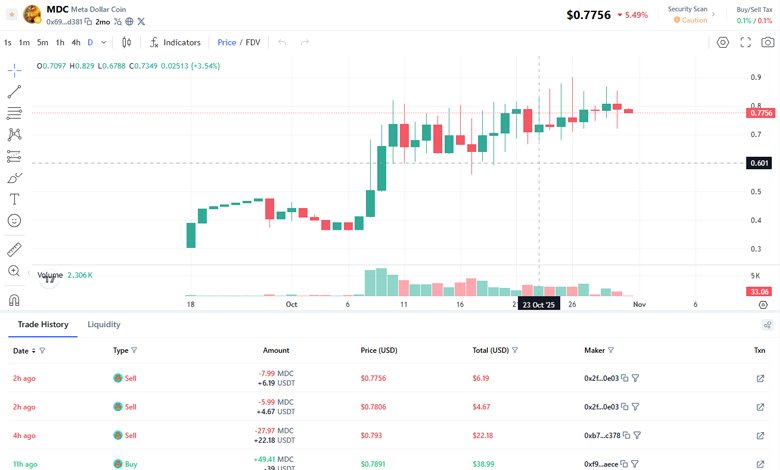
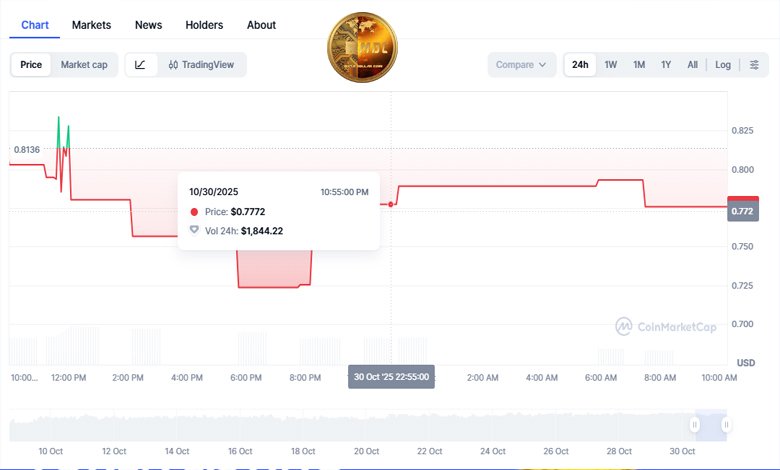
3. Analyzing Price Charts
Click the “Charts” tab on any coin page — you’ll find the price movement over different timeframes (1D, 7D, 1M, 3M, 1Y, ALL).
Key insights:
-
Rising trendline: Strong market momentum.
-
Sharp spikes: Possible news events or whale trades.
-
Long flat lines: Low activity or stable consolidation.
Switch between Linear and Logarithmic views — log charts show percentage-based movements, which help compare coins with vastly different price ranges.
Pro Tip:
Use the “Compare” feature to view how one coin performs against another or against Bitcoin.
4. Dive into Historical Data
Under the “Historical Data” tab, you can access daily price records.
You’ll find:
-
Opening & closing prices
-
Daily highs & lows
-
Volume & market cap
By exporting this data (CSV format), traders can perform technical analysis — spotting price patterns, moving averages, or volatility trends.
5. Reading the Market Overview Section
This section gives a snapshot of the entire crypto market, not just one coin.
It includes:
-
Global Market Cap: The total value of all cryptocurrencies combined.
-
24h Volume (Global): How active the overall market is.
-
BTC Dominance: The percentage of total market cap held by Bitcoin — a key indicator of investor sentiment.
-
High BTC dominance → money flowing into Bitcoin.
-
Falling dominance → altcoins gaining strength.
-
6. Understanding the “Markets” Tab
This tab shows which exchanges list the coin and at what price.
Look for:
-
Volume share per exchange → Helps identify the most active and liquid platforms.
-
Price variation between exchanges → Could suggest arbitrage opportunities (buying low on one exchange and selling higher on another).
-
Trust Score → Coin Market Cap ranks exchanges based on reliability, liquidity, and transparency.
7. On-Chain and Community Data (Advanced Users)
Coin Market Cap also integrates on-chain metrics and social sentiment:
-
Active Addresses – Reflects blockchain usage.
-
Community Metrics – Measures social activity (Twitter, Reddit, Telegram).
-
Developer Data – Tracks GitHub commits and project development.
Pro Tip:
Coins with strong on-chain growth and active development usually have healthier long-term fundamentals.
8. Watchlists and Portfolio Tracking
-
Add favorite coins to your Watchlist to track performance easily.
-
Use the Portfolio Tool to record your purchases and monitor profits/losses in real time.
This transforms Coin Market Cap into a personalized crypto dashboard — perfect for daily market tracking.
9. Reading Coin Ratings and Market Rankings
CMC ranks coins by market capitalization, but you can filter by:
-
Top Gainers / Losers (24h)
-
Recently Added Coins
-
Trending Searches
This data helps spot new opportunities or detect emerging trends early.
10. Use the Coin Market Cap Mobile App
For investors on the move, the CMC app offers:
-
Real-time alerts
-
Price widgets
-
Portfolio sync across devices
Stay updated on sudden market shifts, even when you’re not at your computer.
Final Thoughts
Learning how to read Coin Market Cap charts isn’t just about numbers — it’s about understanding market psychology, investor behavior, and data trends.
By mastering features like price charts, volume data, historical trends, and market rankings, you’ll gain an edge over casual investors.
Whether you’re holding for the long term or trading daily, Coin Market Cap is your window into the heartbeat of the crypto market.